August 2026 Nashville Area Real Estate Market Report | LCT Team
Explore the August 2026 Middle Tennessee real estate market, including home prices, inventory, closings, and trends across Nashville, Franklin, Brentwood, Williamson County, and surrounding areas.
August 2026 Middle Tennessee Real Estate Market Update
Inventory continued to expand across the region while home values remained steady, giving buyers more options and making strategy increasingly important for sellers.
Middle Tennessee entered the final stretch of summer with more homes available and pricing that remained resilient across much of the region. The average sale price increased 3% year-over-year to $637,141 in August 2026, while the median sale price held steady at $450,000.
According to the latest Realtracs data, active inventory increased 10% from August 2025 to an average of 14,294 homes. Total inventory reached 19,672 properties, and months of supply rose to 5.59 months. Together, these figures point to a market offering buyers more time and selection while placing greater importance on pricing, preparation, and presentation for sellers.
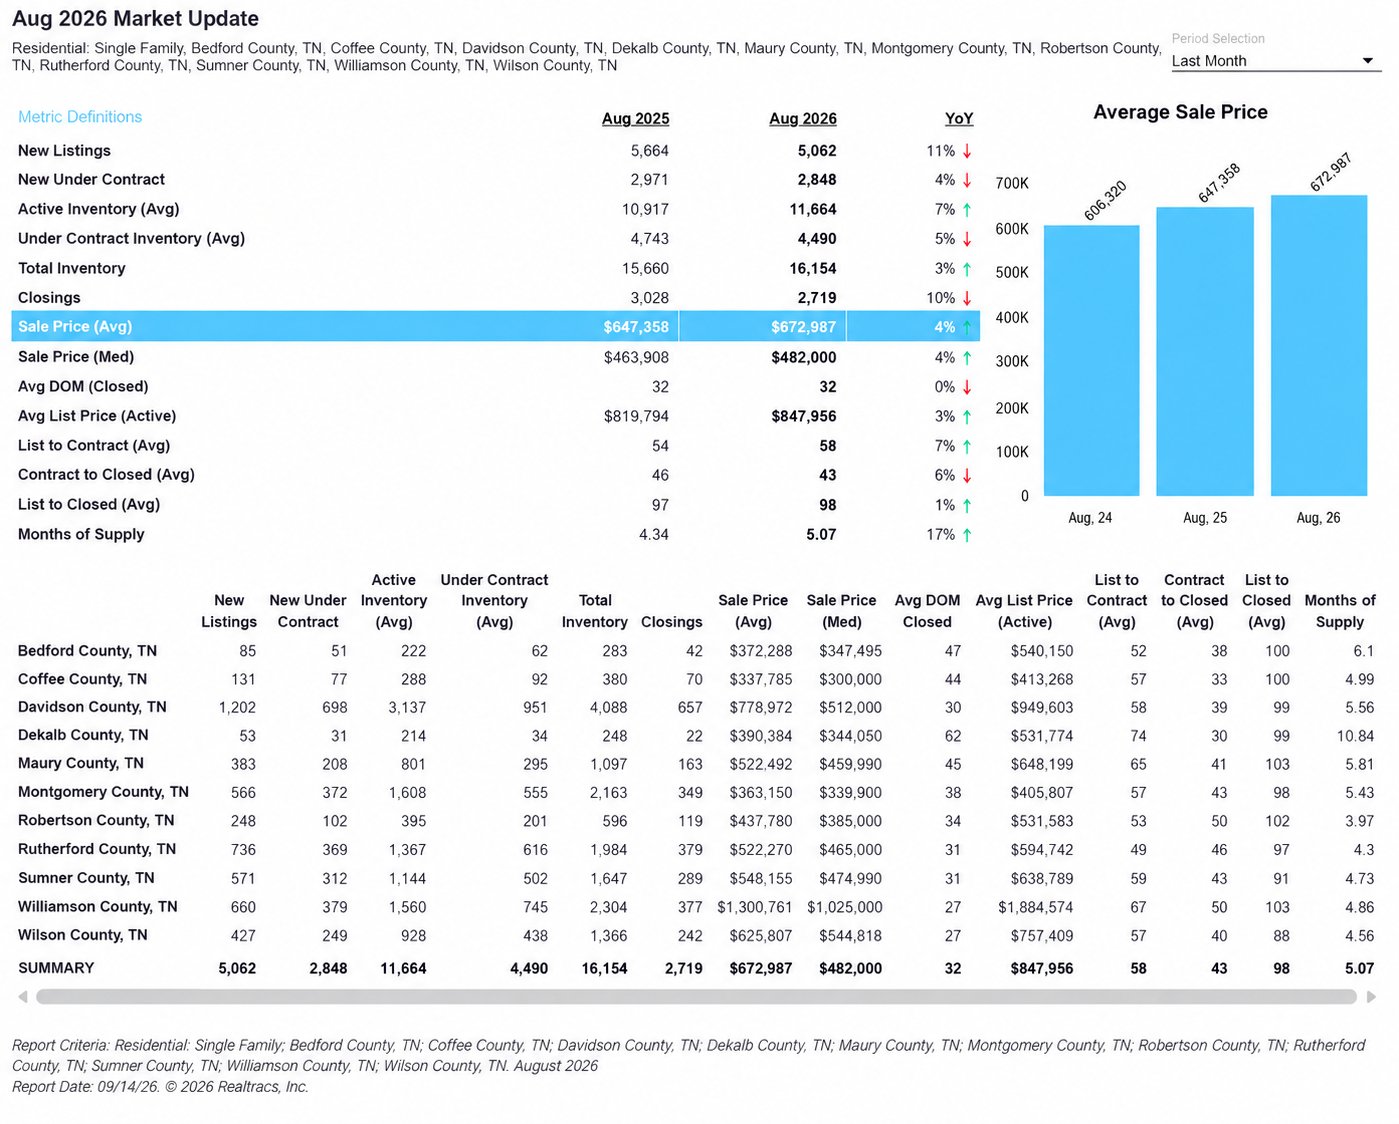
Middle Tennessee Market Snapshot – August 2026
- Closings: 3,003 homes sold (-14% year-over-year)
- New Under Contract: 3,402 properties (+1%)
- New Listings: 5,537 homes (-18%)
- Total Inventory: 19,672 homes (+6%)
- Active Inventory: 14,294 homes (+10%)
- Average Sale Price: $637,141 (+3%)
- Median Sale Price: $450,000 (steady year-over-year)
- Average Days on Market: 34 days
- Months of Supply: 5.59 months (+25%)
Home Prices Remain Steady Across Middle Tennessee
Despite slower closing activity, Middle Tennessee home values continued to hold their ground in August. The average sale price rose from $619,425 in August 2025 to $637,141 this year, representing a 3% year-over-year increase. The median sale price remained nearly unchanged at $450,000 compared with $449,000 last August.
The difference between the average and median prices suggests that activity within the region’s upper price ranges continues to support the overall average. Market performance remains highly specific to each neighborhood, price point, property type, and condition.
Growing Inventory Gives Buyers More Options
Active inventory averaged 14,294 homes in August, a 10% increase from the same period last year. Total inventory, which includes properties already under contract, reached 19,672 homes. Months of supply increased from 4.46 months in August 2025 to 5.59 months this year.
For buyers, this expanded selection can provide more opportunities to compare properties and negotiate terms. Some sellers may be open to price adjustments, closing-cost assistance, rate-buydown contributions, or other concessions, particularly when a home has been on the market for an extended period.
However, desirable homes that are well maintained and appropriately priced can still attract attention quickly. Buyers should remain prepared to act when the right property becomes available, even within a market offering more overall inventory.
Fewer New Listings Entered the Market
New listing activity slowed considerably during August, with 5,537 homes entering the market—an 18% decline from August 2025. At the same time, new under-contract activity remained relatively stable at 3,402 properties, up 1% year-over-year.
This combination shows that buyer activity has not disappeared, but buyers are moving carefully and concentrating on homes that offer the strongest combination of location, condition, pricing, and value. For sellers, entering the market with a well-defined strategy is increasingly important when buyers have more existing inventory to consider.
Williamson County Continues to Lead in Home Values
Williamson County remained the region’s highest-priced market in August, supported by demand for homes in Franklin, Brentwood, College Grove, Arrington, Nolensville, and the surrounding communities. The county recorded an average sale price above $1.2 million, while its median sale price increased 6% year-over-year to $929,990.
- Williamson County Average Sale Price: $1,213,904
- Williamson County Median Sale Price: $929,990
- Williamson County Closings: 422 homes sold
- Williamson County Active Inventory: 1,802 homes
- Williamson County Average Days on Market: 27 days
- Williamson County Months of Supply: 5.03 months
While inventory has increased, Williamson County’s strong median price demonstrates the continued value buyers place on its communities, schools, amenities, new construction opportunities, and proximity to Nashville.
Nashville Remains a Key Part of Regional Activity
Davidson County continued to offer buyers a broad selection of properties throughout Nashville and its surrounding neighborhoods. The county’s median sale price reached $532,500 in August, while the average sale price approached $780,000.
- Davidson County Average Sale Price: Approximately $780,000
- Davidson County Median Sale Price: $532,500
- Davidson County New Listings: 1,366 homes
- Davidson County New Under Contract: 668 properties
- Davidson County Total Inventory: Approximately 4,100 homes
- Davidson County Months of Supply: 4.79 months
Market conditions can vary substantially between neighborhoods and property types within Davidson County. Pricing and activity in areas such as Green Hills, Belle Meade, 12 South, East Nashville, Germantown, and downtown Nashville may differ from broader countywide trends.
A Market That Rewards Thoughtful Decisions
August’s numbers reflect a market moving closer to balance. Buyers have access to more inventory and may have greater negotiating flexibility, while sellers continue to benefit from stable home values throughout much of Middle Tennessee.
For sellers, the increase in competition means that ambitious pricing can result in longer market times. Homes that are accurately positioned from the beginning, professionally presented, and supported by a comprehensive marketing plan are more likely to capture attention from serious buyers.
For buyers, additional inventory can provide valuable breathing room, but opportunities differ widely by location and price range. A home that has been sitting on the market may offer room to negotiate, while a standout property can still generate immediate interest.
What This Means for Buyers & Sellers
For buyers, August’s inventory growth provides a broader selection of homes throughout Nashville, Franklin, Brentwood, College Grove, Arrington, and the surrounding Middle Tennessee communities. Depending on the property, buyers may also have opportunities to negotiate price, repairs, closing costs, or financing incentives.
For sellers, steady pricing remains encouraging, but increased inventory makes a strong first impression more important. Strategic pricing, professional photography, thoughtful staging, targeted advertising, and exposure to the right audience can help a home distinguish itself from competing listings.
Looking Ahead to Fall 2026
As the market transitions into fall, buyers and sellers will continue to navigate a greater supply of available homes, stable overall pricing, and activity that varies considerably between communities and price points.
Understanding how these regional numbers apply to a specific neighborhood or property requires a closer look at recent comparable sales, current competition, buyer activity, and local market conditions. A personalized strategy can help buyers recognize meaningful opportunities and help sellers position their property effectively from the start.
Whether you are considering buying, selling, building, or simply want to understand what your home could be worth in today’s market, the LCT Team is here to help you make your next move with confidence.
The LCT Team serves clients throughout Franklin, Brentwood, Nashville, College Grove, Arrington, and Williamson County with an experienced approach to luxury real estate, strategic marketing, and personalized client service.
Call us today to get started at (615) 595-5883.
Market statistics are based on August 2026 residential data reported by Realtracs MLS. Figures may be revised as additional transactions are entered into the MLS.