
December 2024 Real Estate Market Update
As we wrapped up 2024, the real estate market showcased some notable trends across our region. Here’s a detailed look at December’s numbers and year-to-date (YTD) performance.
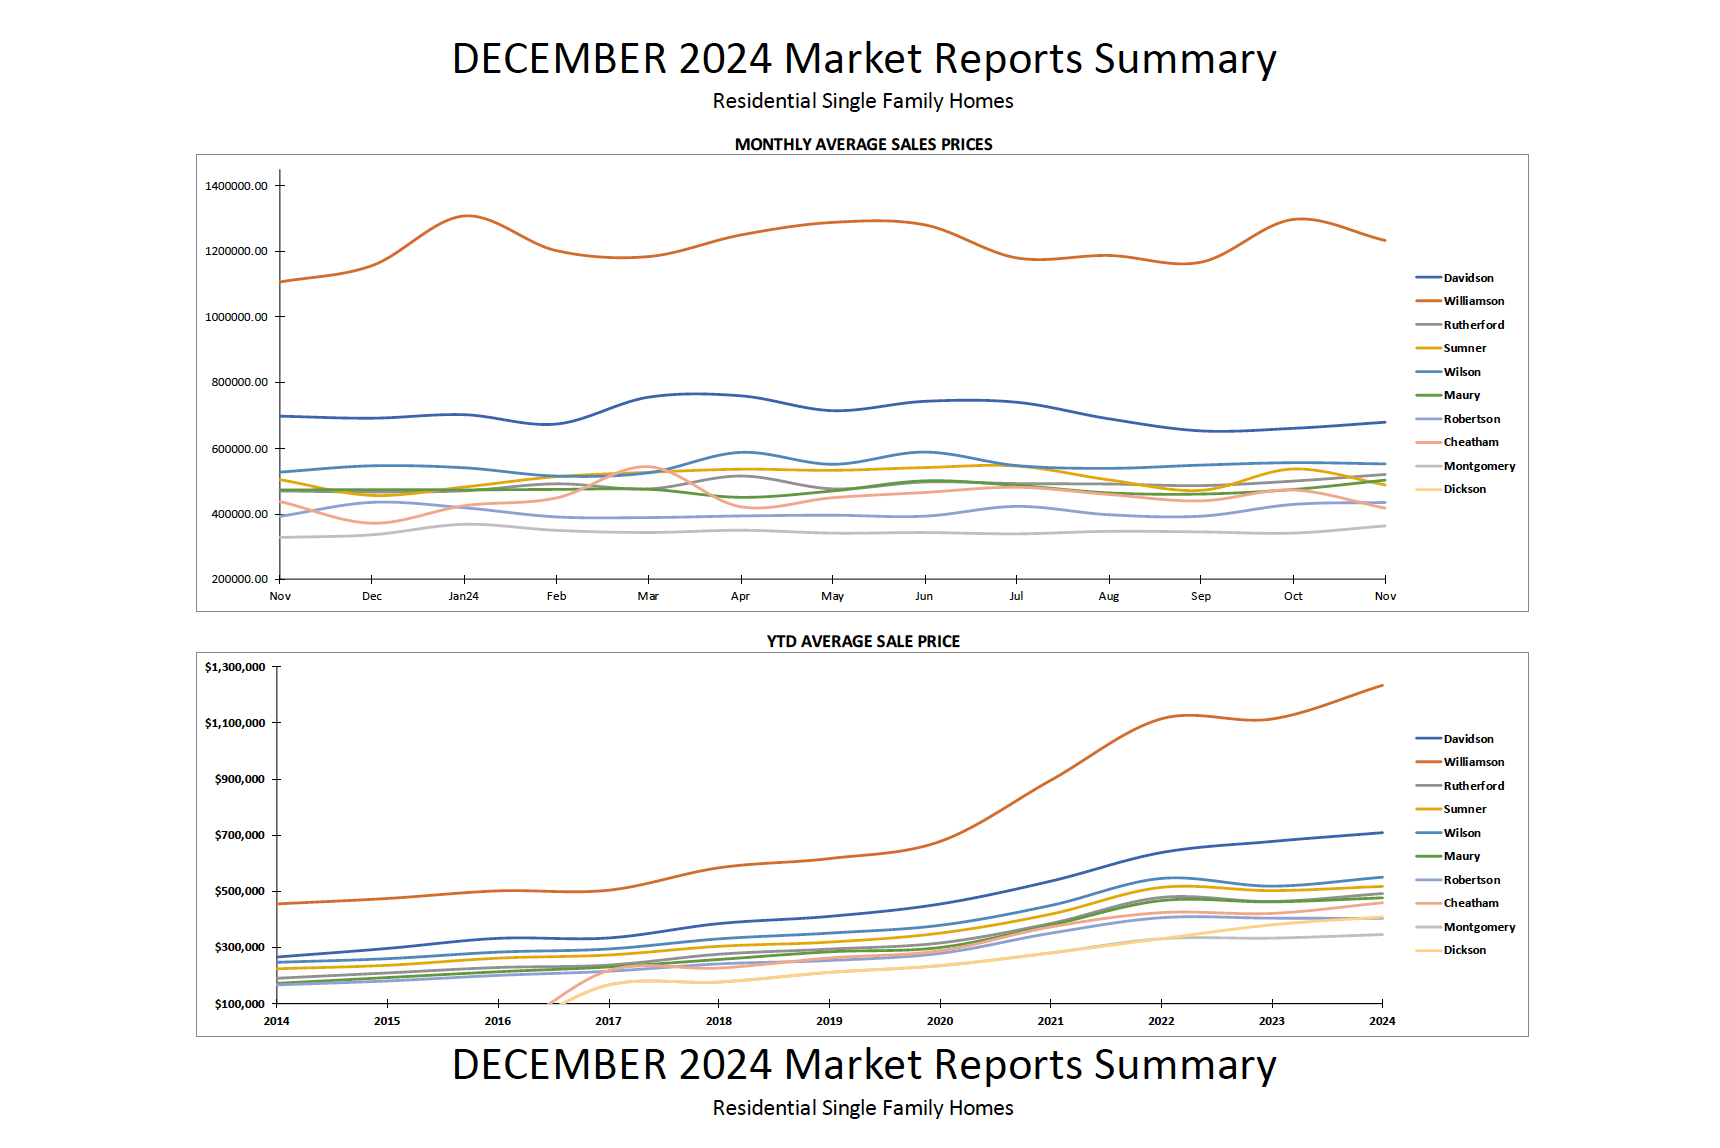
Sales Prices: A Strong Finish in Most Counties
December sales prices outperformed last year in all counties except Davidson, Montgomery, and Robertson. However, on a YTD basis, every county reported higher sales prices compared to 2023. Williamson County led the way with an impressive 9.5% increase, while Robertson County saw a modest rise of 0.1%.
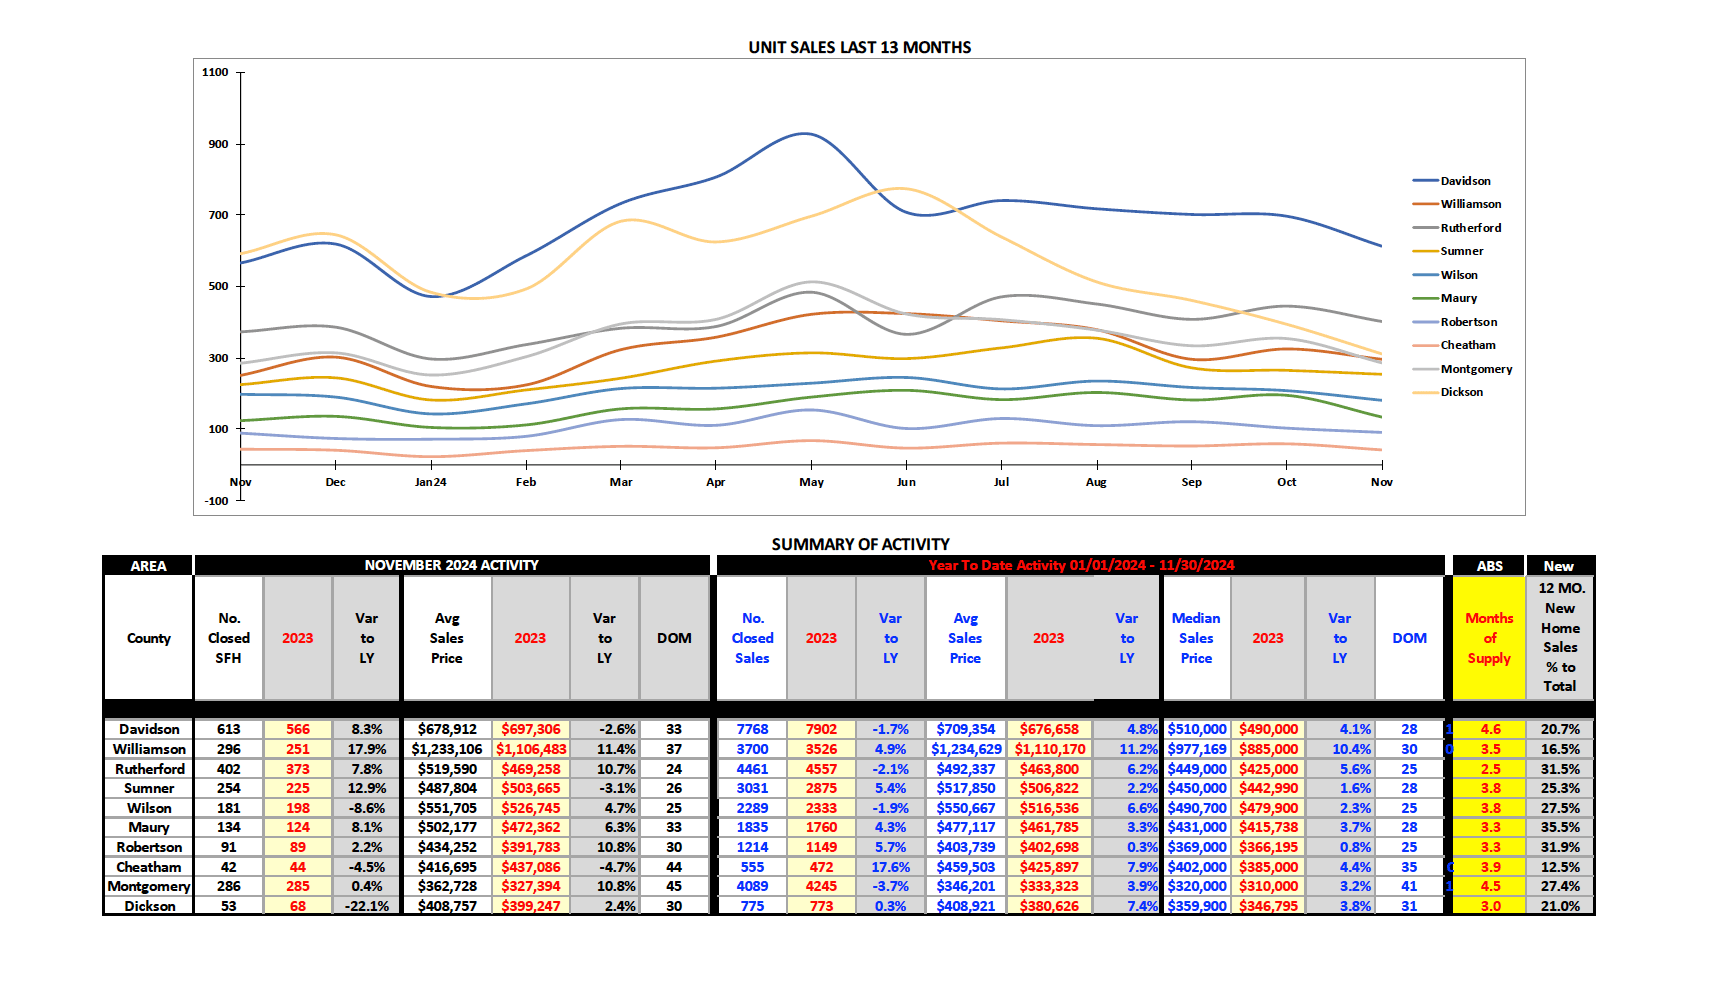
Unit Sales: December Gains with Mixed YTD Results
Unit sales in December 2024 were higher than the previous year in most counties. Looking at the full year, Davidson, Dickson, Montgomery, Rutherford, and Wilson counties experienced slightly lower unit sales compared to 2023.
Inventory Supply: Adequate but Varies Across Counties
As of January, inventory supply varies significantly:
- Cheatham County: 5.1 months of supply (highest).
- Rutherford County: 2.6 months of supply (lowest).
Other counties fall between these two ranges, indicating a generally balanced market in some areas and tighter conditions in others.
Days on Market: Slight Decrease YTD
The average time homes spent on the market in December 2024 was 31.1 days, down slightly from 32.2 days the previous month. On a YTD basis, the number of Days on Market decreased by an average of 1.1 days in most counties, a sign of steady demand.
New Home Sales vs. Existing Sales: A County-by-County Breakdown
Over the past 12 months, new home sales made up the highest percentage of total sales in Maury County at 35.2%, while Cheatham County reported the lowest percentage at 13.7%. The average across all counties was 25.1%, reflecting a healthy mix of new and existing home activity.
Final Thoughts
The data from December and 2024 overall highlights a dynamic real estate market with opportunities for both buyers and sellers. As we move into 2025, inventory levels, sales trends, and market demand will be key factors to watch. Stay tuned for more updates and insights as we navigate the new year together. If you have questions about your local market or are ready to buy or sell, our team is here to help!
Looking for Your Next Home in Franklin or Nashville?
Connect the LCT Team today to start your journey. Whether you’re a first-time buyer or looking for your dream property, Middle Tennessee’s market offers endless opportunities to invest in a community you’ll love for years to come. (615) 595-5883 or visit LCTTeam.com.