
Nashville Area Real Estate: October 2024 Market Insights
October 2024 brought a mix of changes to the Nashville area real estate market. From rising sales prices in most counties to shifts in unit sales and inventory levels, here’s a snapshot of the latest trends that shaped the region’s housing market.
Key Highlights from October 2024
- Sales Prices:
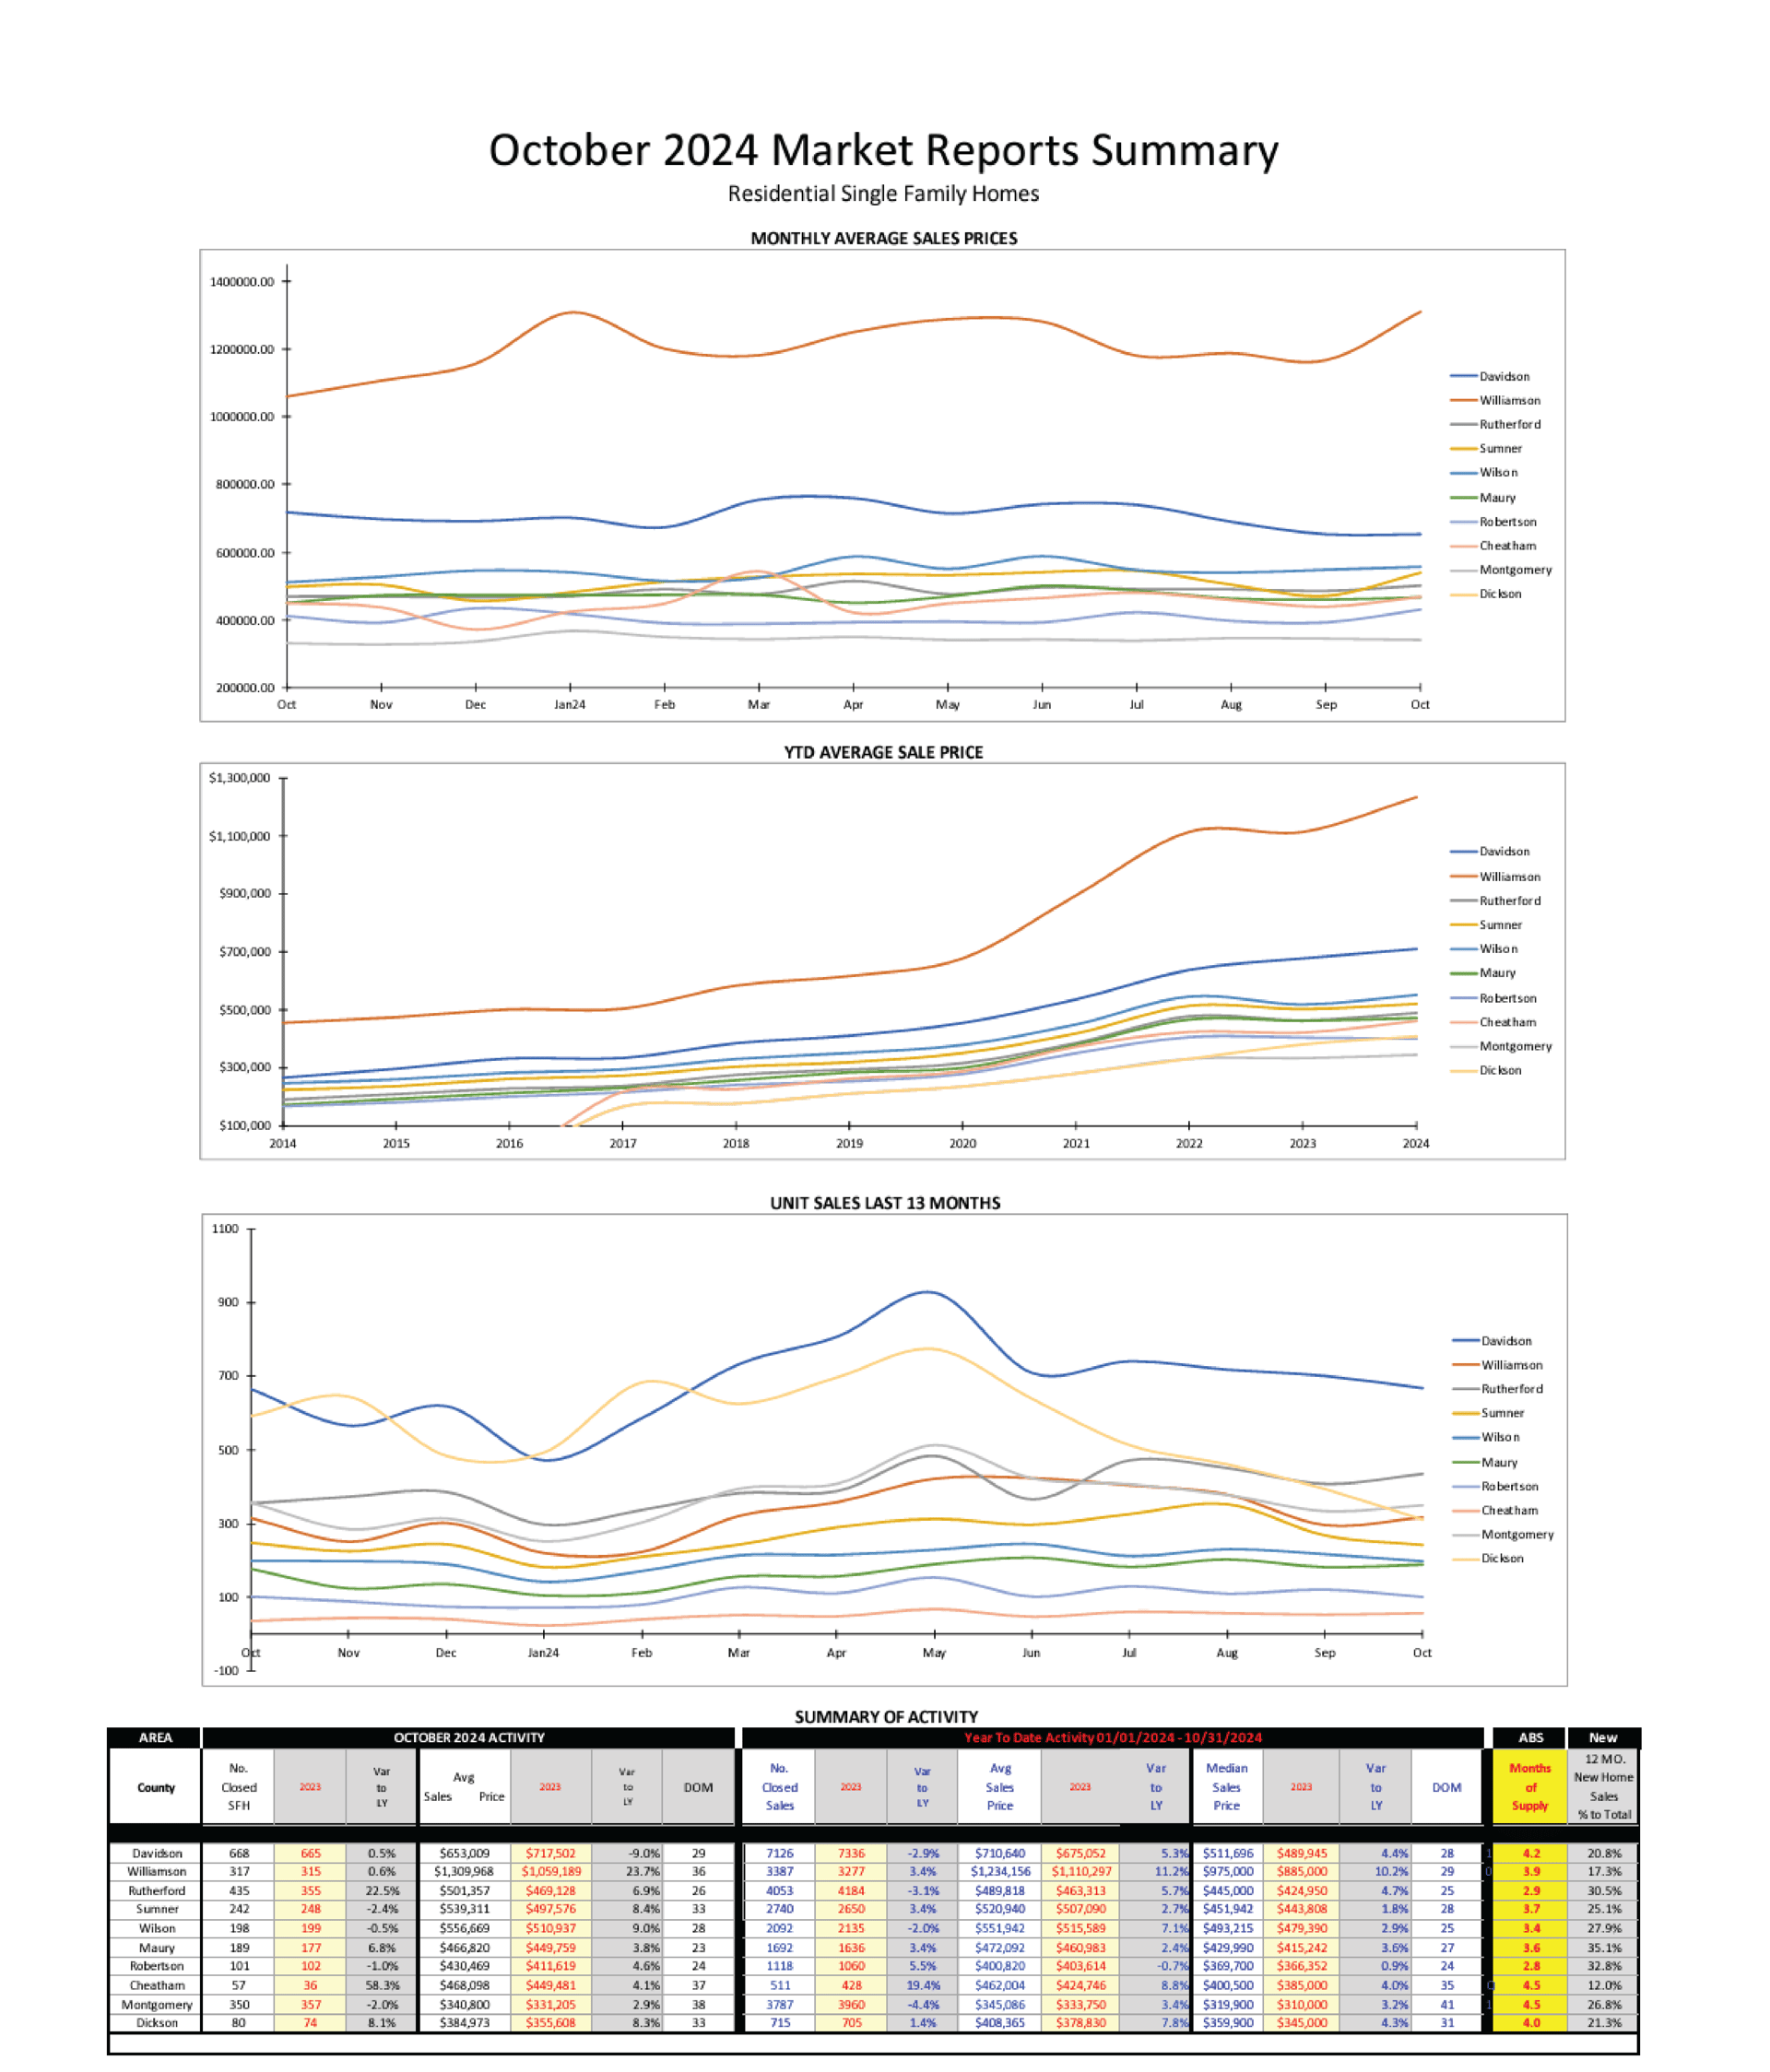
- Most counties saw increases in sales prices compared to October 2023, except Davidson County.
- Year-to-date (YTD), sales prices were higher in Cheatham, Davidson, Dickson, Maury, Montgomery, Rutherford, and Sumner counties compared to last year.
- Williamson County led with a 10% YTD price increase, while Robertson County experienced a slight decline of 0.7%.
- Unit Sales:
- October 2024 unit sales exceeded last year’s figures in six counties.
- On a YTD basis, Davidson, Montgomery, Rutherford, and Wilson counties reported fewer unit sales than in 2023.
- Inventory Supply:
- As of November, inventory ranged from 4.5 months of supply in Montgomery County to 2.8 months in Robertson County, with other counties falling between these levels.
- Days on Market (DOM):
- Homes spent an average of 41 days on the market YTD in Montgomery County, the highest in the region.
- Robertson County saw the lowest average DOM at 24 days.
- New vs. Existing Home Sales:
- Over the last 12 months, Maury County had the highest proportion of new home sales at 35.1%, while Cheatham County recorded the lowest at 12.0%.
- Across all counties, new homes accounted for an average of 25% of total sales.
This month’s data reveals ongoing market activity and shifts across Nashville’s counties. Buyers and sellers should watch these trends as we move closer to the year-end market wrap-up.